Is another recession on the Horizon?
Foreword
The global economy had demonstrated a high degree of correlation to the economic fortunes of the biggest economies in the world. In the representation below, the economy of the United States is shown to be the biggest globally representing 24.4% of the world's GDP. If the United States do show economic weakness, that same weakness will soon spread to the rest of the world through the global trade flows.

I am in the opinion that a recession could crystallise in about 1 to 1 1/2 years (read Q3 2020 - Q2 2021). This opinion holds the assumption that American policy makers and the Fed do not change their current policies drastically. I will explain how I had come to that opinion in this article.
The prospect of the Fed normalising (raising interest rates and unwinding the balance sheet) and the ongoing trade war; introduced much volatility and downside risk to the financial markets.
Investor sentiment has also been impacted by the possibility of higher financing costs since late 2014 and then the prospect of an economic slow down brought on by punitive trade tariffs in response to the American protectionist approach to managing the trade deficit in 2018. This is evident in the yield spreads seen in the chart below.
The shorter term yield would track the Fed Benchmark more closely than the longer maturity yield. The belief here is traders pricing the longer term instrument would be effectively giving their view on interest rates in the future. In the scenario where the longer term yields cross under the shorter term yield, it suggests an expectation that rates in the future will be lowered due to the possibility of a slower economy in need of a Fed stimulus.
Observers are in the view that such term yield spreads do lead the advent of a recession by about a year. Arbitrary that view might seem, it is not without merit as you can see in the chart below.
The widest point in the spreads are about a year to the start of the recessions in 2001 and in 2008. If the observation of the most recent peak in the spread should be taken into account (circled in red), then the count down to the next recession has already begun. Also note that the longest bull run starting from early 2009 have appeared to stall in 2018 as seen in the sideways price action on the Dow Jones Index.
The temptation to call the timing of the next recession based solely off this observation is inviting but I am in the opinion that indicators derived from GDP generating activities should also be examined to see if the manifested expectations are indeed of substance.

I am in the opinion that a recession could crystallise in about 1 to 1 1/2 years (read Q3 2020 - Q2 2021). This opinion holds the assumption that American policy makers and the Fed do not change their current policies drastically. I will explain how I had come to that opinion in this article.
Economic Sentiment and Expectations
Since the recession of 2008-2009, the American story had been that of recovery and unprecedented growth lasting almost a decade under the auspices of the Fed's aggressive expansionary monetary policy. Most will recognise that regimen as QE or Quantitative Easing. As cheap financing is readily available through debt, most firms are highly leveraged and are hence more sensitive to interest rate moves as a consequence.The prospect of the Fed normalising (raising interest rates and unwinding the balance sheet) and the ongoing trade war; introduced much volatility and downside risk to the financial markets.
Investor sentiment has also been impacted by the possibility of higher financing costs since late 2014 and then the prospect of an economic slow down brought on by punitive trade tariffs in response to the American protectionist approach to managing the trade deficit in 2018. This is evident in the yield spreads seen in the chart below.
 |
| Dow Jones Index with the US 30 Year Treasury Yield and US 13 week Treasury Yield in Overlay |
Observers are in the view that such term yield spreads do lead the advent of a recession by about a year. Arbitrary that view might seem, it is not without merit as you can see in the chart below.
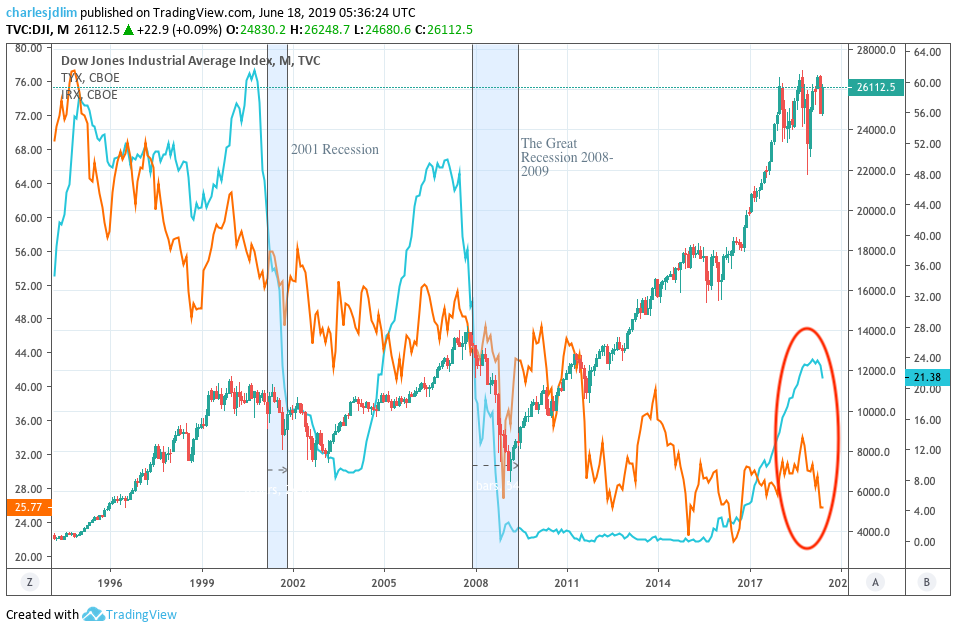 |
| Short - Long Duration Yield Spread Overlay to the DJI with Recessions marked out |
The widest point in the spreads are about a year to the start of the recessions in 2001 and in 2008. If the observation of the most recent peak in the spread should be taken into account (circled in red), then the count down to the next recession has already begun. Also note that the longest bull run starting from early 2009 have appeared to stall in 2018 as seen in the sideways price action on the Dow Jones Index.
The temptation to call the timing of the next recession based solely off this observation is inviting but I am in the opinion that indicators derived from GDP generating activities should also be examined to see if the manifested expectations are indeed of substance.
Loan Delinquencies (Financing Activity)
 |
| Number of Loan and Lease delinquencies shown around recessions |
It is noted that delinquencies have risen sharply in 2015 to 2016. This coincided with the first rate rise on Dec 17th 2015 from 0.25% to 0.5% effectively ending the QE interest rate regimen. This is evidence of businesses becoming highly leveraged during the QE era struggled to meet interest commitments when cheap financing evaporated.
During the rate normalising period, the Fed maintained a steady increase in rates from 0.75% in 2016 through 2018 to 2.5%. The Fed had kept rate increases on hold in 2019 at the time of this article.
Businesses have also been renegotiating the terms or to restructure their debt to better service it. This results in lease financing receivables due from the businesses.

In the above chart, the delinquency rate for financing receivables have been observed to rise steadily as businesses who had restructured their loans fail to meet their negotiated commitments. This observed increase in delinquencies could be the result of a slowdown in the sales of goods and services or a miscalculation stemming from bad business decisions around the businesses capital structure.
The fact that delinquencies are on the rise could be an indication of a shakedown of businesses with weak fundamentals; or the beginning of an economic slow down.
The fact that delinquencies are on the rise could be an indication of a shakedown of businesses with weak fundamentals; or the beginning of an economic slow down.
GDP Components

In the above table, we see the weightage of each component of expenditure that goes into the American GDP. Consumer spending is the main driver for economic growth. It is closely followed by investing and government expenditure.
This is important because it gives us an idea of whose sentiment and expectations will essentially dictate where the economy goes.
Consumer Spending

Consumer spending represented here by Monthly Retail Sales of Food and Services have been observed to rise steadily with dips (shown as sharp extended dips in the red line) with the largest occurring in early 2019 and during the great recession of 2008-2009.
Expenditure that fall within this class is deemed essential expenditure and any sharp moves could be interpreted as the result of economic hardship.
The largest dip in the above chart took place around the recession in 2008-2009. The retail number changes range typically in positive territory right up till the economic event.
In the above chart, inflation hasn't been adjusted for and you can see the percentage changes ranged within a uniform band around 0.50% (denoted by the yellow channel lines)

With inflation adjusted for in the above chart, we can see the percentage changes to be more pronounced. The bands the percentage change travels in moves from month to month. It's seen to shift downward in the lead up to the great recession of 2008-2009 (Shown by the red arrow). and more recently, the percentage change highs have been observed to move lower.(Blue arrows) Also note that the negative changes appear to increase in contrast to the positive moves.
Retail sales numbers remain on the positive slope but have been observed to reflect the timing of interest rate announcements and economic growth concerns with pronounced dips (Circled)
Even though retail numbers continue to rise, the rate at which the numbers increase at appears to move lower. This can be interpreted as the result of consumers reducing their expenditure on essentials to prepare for a perceived economic slowdown. I am in the view that such behaviour does in fact dampen economic growth if allowed to take hold making the economic slow down a self-fulfilling prophecy.
Corporate investment expenditure
 |
| New Durables Orders |
In light of the recent drop in growth of consumer driven spending, businesses have reflected slower business with a drop in new durable orders evidenced by a drop from the peak in July of 2018.(Red Arrow). The order growth appears to be consolidating as businesses pull back on their expectation of demand growth starting late 2017.
CAPEX expenditure has also been observed to steadily decrease since Oct 2017 (seen in the CAPEX chart below). This observation corroborates the view that businesses have pulled back on their expectation of continued demand growth in the economy going forward.
 |
| CAPEX |
Household Income

The unemployment numbers have decreased uniformly since the height of the recession. In late 2018 and early 2019, a sight bump was observed possibly a result of business failures from failing to meet loan commitments. Though unemployment is under pre financial crisis levels, what we can see that is left is structural unemployment. What we have at the moment is as close to full employment as an economy can be at.
This is interesting because it demonstrates that the spending behaviour of the typical American (discussed earlier on) is driven more by their outlook than their current financial situation.
This is interesting because it demonstrates that the spending behaviour of the typical American (discussed earlier on) is driven more by their outlook than their current financial situation.

Another labour market indicator is presented by Non Farm Payrolls. In the above chart, we can see that the numbers do not appear to dip very often towards zero. This is congruent to the unemployment situation shown above.
This is yet more proof that consumers do not spend according to their current situation but plans around their expectations pertaining to their future income levels.
International Trade

The US has always been a net importer of goods and services and it shows in the Balance of Trade deficit as seen in the above chart.
According to the GDP makeup, the impact of trade is negligible to GDP growth if kept at where it was pre-2018. The situation has unfortunately changed with the recent protectionist measures policy makers had undertaken with a view to improving the balance of trade. This is now a case of the tail wagging the dog.
According to the GDP makeup, the impact of trade is negligible to GDP growth if kept at where it was pre-2018. The situation has unfortunately changed with the recent protectionist measures policy makers had undertaken with a view to improving the balance of trade. This is now a case of the tail wagging the dog.
When tariffs are imposed on key imports what it was meant to do was to keep goods that were produced at a lower cost (read more cost effectively produced) to become more expensive than the locally produced goods. This however often causes punitive measures to be undertaken by the trading partner now affected by the trade tariffs and the situation spirals outwards impacting consumers through higher prices for goods; services and food. In the short term, spending behaviour is impacted through the higher prices of goods. In the long run, business are impacted by the reduced expenditure and that drop in profitability feeds back into the consumer's psyche escalating the downward economic cycle.
Prognosis
The case for a recession by Q3 of 2020 to Q2 of 2021 is strong as discussed above. The question remains now is what do you do about it.
Investments
I do take a portfolio approach when formulating a recommendation for an investment vehicle. In the event of a market shock brought upon by an economic event, a phenomenon known as Beta expansion occurs (see circled in red below) it is when all asset classes move in the same direction.

It does put to question the veracity of portfolio diversification and why should it be undertaken.
Crypto Assets
For some who are into Crypto currencies and think your holdings there will be safe from the broader market move. In the chart seen below, it does look like the Crypto markets do march to the beat of it's own drum. the question remains however is what is beating that drum.

for starters Crypto currencies appear to be a highly correlated class of investments but is negatively correlated to the mainstream assets. It is tempting to say that Crypto currencies will be good to hold as an asset to diversify a portfolio. I do however have another concern in regards to the nature of this asset class vis-a-vis it's status as an asset.
Everyone who holds Crypto in their portfolio has a business; a job; holdings in the conventional asset classes through their 401K or other government sponsored investment vehicles. What happens when the world market crashes and people start losing their jobs and their investments and have liquidity needs? They would start to pull their investments to cut their losses. For people who hold BTC, presently at USD 9531.21 to the BTC, the temptation to liquidate one for liquidity needs is pretty great to keep a lifestyle and or to keep a business afloat.
Now imagine everyone does that what do you think happens to the BTC? It becomes a drop and when people start seeing how their savings start to evaporate, they will start pulling out of that market faster than you can tweet "HODL". Jokes aside, as an asset, the crypto market has in reality yet to go through their first test. I am curious to find out if in reality beta expansion would or would not affect this class of assets.
Charles JD Lim, CAIA
Everyone who holds Crypto in their portfolio has a business; a job; holdings in the conventional asset classes through their 401K or other government sponsored investment vehicles. What happens when the world market crashes and people start losing their jobs and their investments and have liquidity needs? They would start to pull their investments to cut their losses. For people who hold BTC, presently at USD 9531.21 to the BTC, the temptation to liquidate one for liquidity needs is pretty great to keep a lifestyle and or to keep a business afloat.
Now imagine everyone does that what do you think happens to the BTC? It becomes a drop and when people start seeing how their savings start to evaporate, they will start pulling out of that market faster than you can tweet "HODL". Jokes aside, as an asset, the crypto market has in reality yet to go through their first test. I am curious to find out if in reality beta expansion would or would not affect this class of assets.
Conclusion
The possibility of a recession by Q3 of 2020 - Q2 of 2021 is high. This is supported through observing a slowdown in business activity through the expenditure patterns and trend of both the consumer and businesses. When the slowdown is allowed to take hold and spread, market crashes will not be far behind.
No asset class will be immune to a market crash especially one caused by an economic event. I am in the opinion that people should rebalance into inflation linked bond investments or highly defensive composite portfolios within the year. For those who are self directed investors, you might want to start pulling out of what appears to be a sideways market when new highs are reached.
No asset class will be immune to a market crash especially one caused by an economic event. I am in the opinion that people should rebalance into inflation linked bond investments or highly defensive composite portfolios within the year. For those who are self directed investors, you might want to start pulling out of what appears to be a sideways market when new highs are reached.
I am in the opinion that unless the Feds watch the emerging situation closely and act accordingly; and Policy makers drop protectionist posturing and policies that hurt businesses; a recession will be imminent.